At a Glance: What 2025 Water Quality Monitoring Data Tells Us
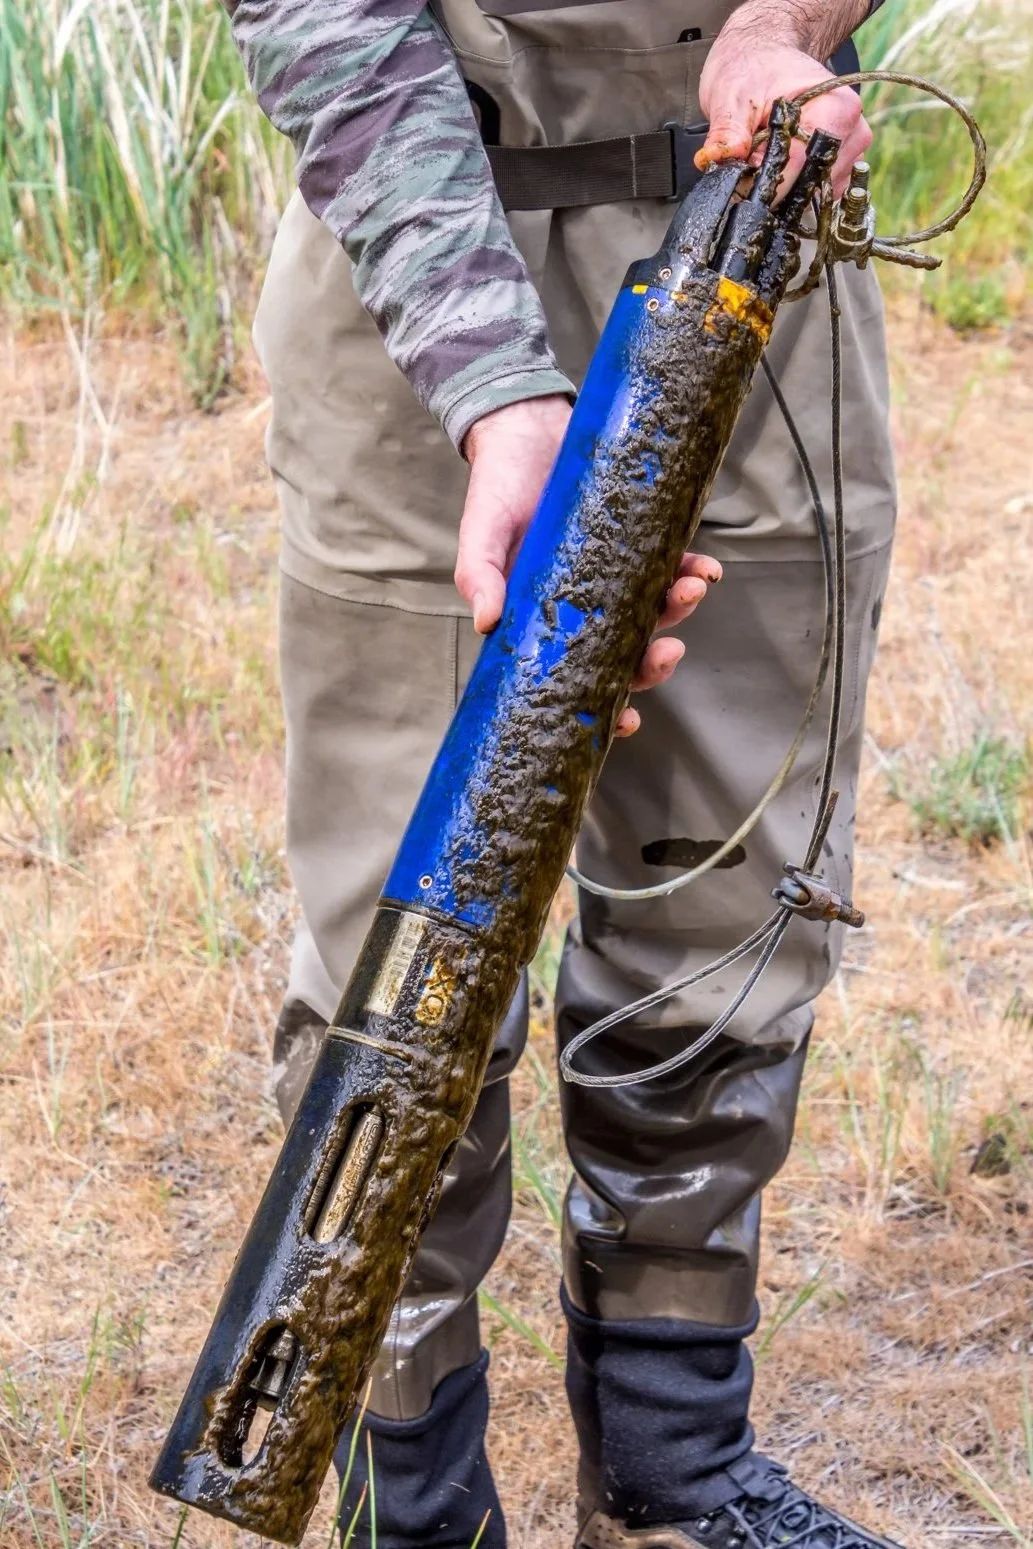
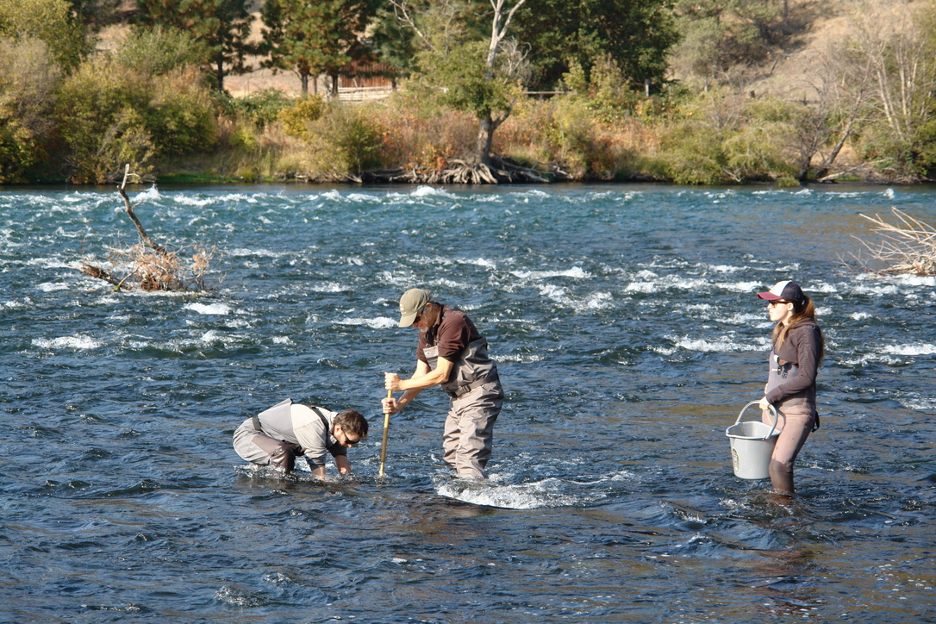
Thanks for another year of service: YSI Data Sondes at three locations were pulled near the end of November, marking the end of another water quality monitoring season.
Wrapping Up Another Monitoring Season
By Hannah Camel
The 2025 monitoring season has come to a close, marking the 10th year the DRA has collected continuous water quality data on the lower Deschutes River. There’s no better way to celebrate this milestone than with a successful season that included an exciting addition to our monitoring program—a third monitoring station near the mouth of the Deschutes. This new site allows us to better understand longitudinal changes in water quality along the entire lower Deschutes, providing a more complete picture of conditions from Warm Springs to the Columbia River.
On November 19th and 20th, we removed all three YSI data sondes from the river. These sensors have been continuously collecting water quality data since being deployed on April 17 (April 25 at the new Moody site). During the 2025 season, we collected 217 days of data for all parameters at the Warm Springs site and 212 days at the Maupin site. The Moody site was deployed slightly later and recorded 210 days of temperature data; however, data collection for pH (176 days) and dissolved oxygen (189 days) was limited due to equipment issues and ordering delays.
As in previous years, this monitoring effort focused on evaluating compliance with Oregon Department of Environmental Quality (DEQ) water quality standards, which are designed to protect river health and support native fish populations. Below is a snapshot of what the 2025 data reveals.
Let’s Do The Numbers
Warm Springs Site
The primary concern at this site was elevated pH, which exceeded the basin-wide standard of 8.5 on 123 of 217 days (57%). High pH can disrupt physiological processes in aquatic organisms, increasing stress and making fish more susceptible to disease and mortality. Dissolved oxygen levels consistently met standards; however, temperature violations occurred on 20 of 217 days (9%). Notably, all of these violations occurred during the salmon and steelhead spawning season (October 15 – June 15), a critical time for these cold-water species. It is also important to note that DEQ currently applies stricter DO and temperature spawning standards only through June 15th. This fails to protect resident trout spawning, which is well-documented to continue until August.
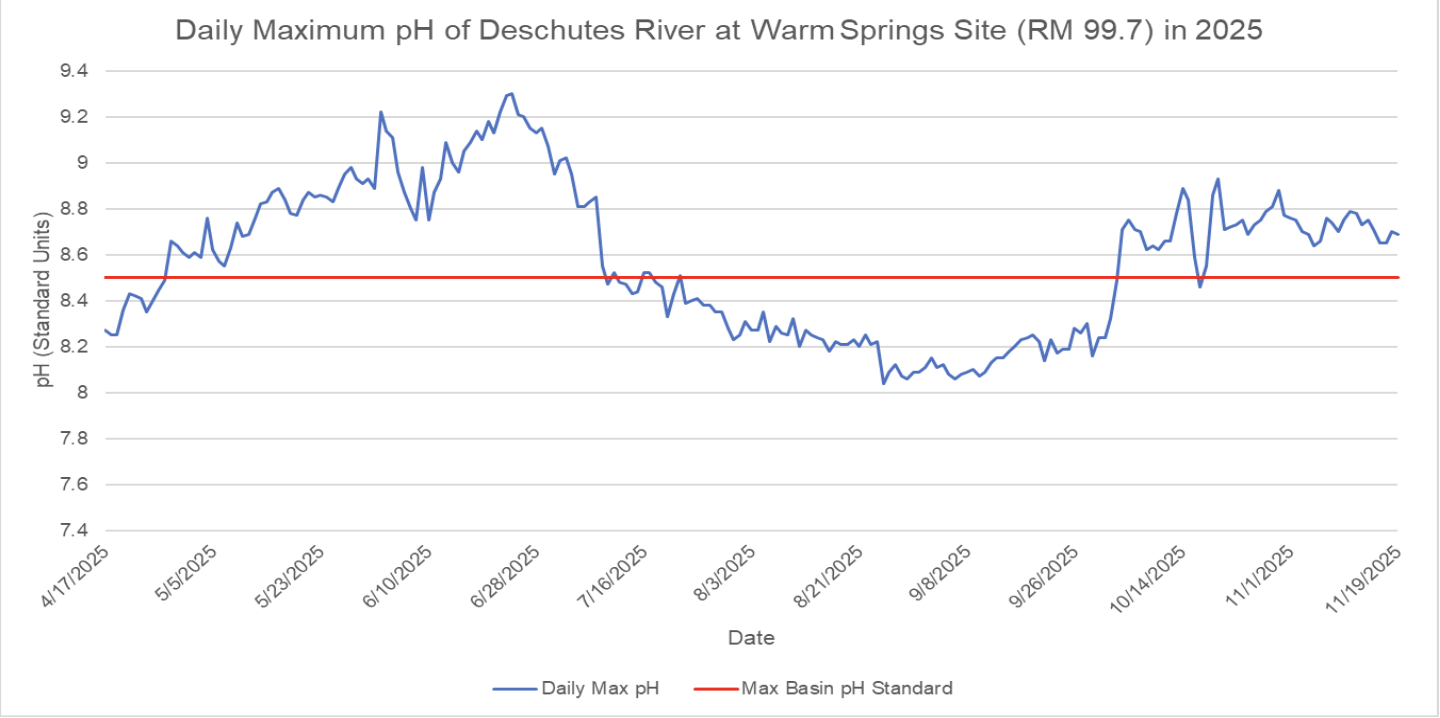
pH levels as recorded at the Warm Springs monitoring site.
Maupin Site
Data from Maupin showed near-continuous pH violations, with 210 of 212 days (99%) exceeding the standard. This persistent issue points to systemic factors influencing water chemistry at this location. Additionally, 59 of 212 days (27%) violated the DO standard, all occurring during the salmon and steelhead spawning season (October 15–May 15 in this reach). Meanwhile, temperature violations were recorded on 26 of 212 days (12%), all occurring during the salmon and steelhead spawning season as well.
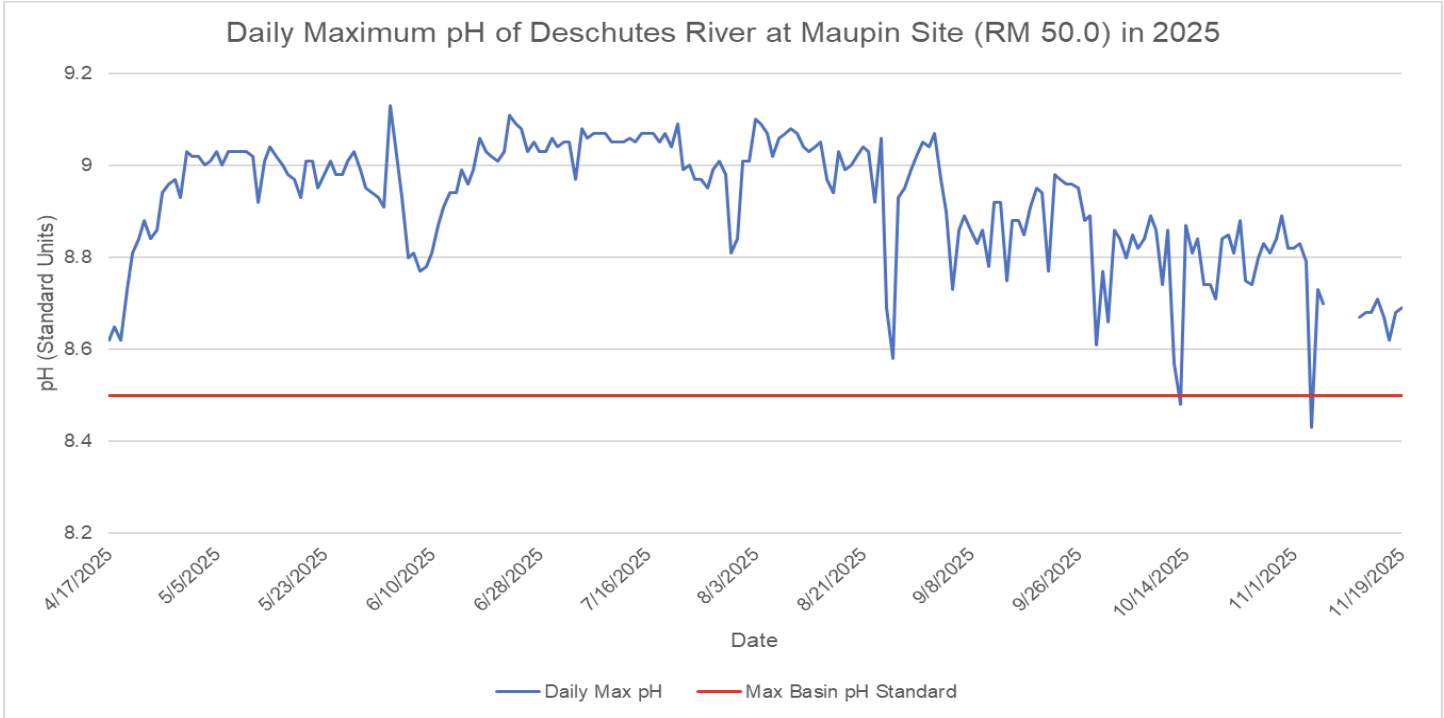
210 out of 212 days were recorded in violation of the state pH standard at the Maupin site in 2025.
Moody Site
The new monitoring station near the mouth of the Deschutes also exhibited widespread pH violations, with 173 of 176 days (98%) exceeding the basin standard. Additionally, there were 15 days of DO violations, indicating intermittent periods of reduced oxygen availability. Finally, temperature violations at this site were the most frequent of the three locations, with 145 of 210 days (69%) exceeding state standards.
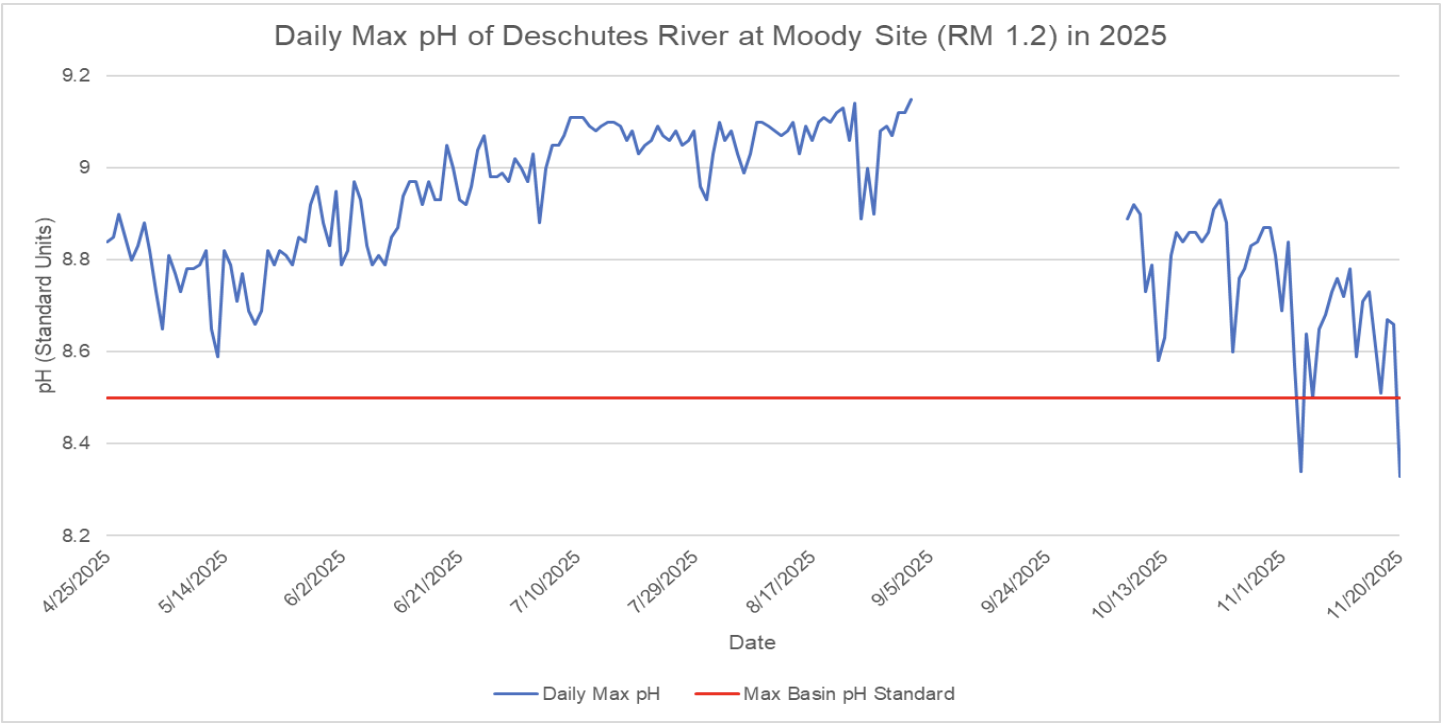
Ph levels as recorded at the Moody site. 173 of 176 days in violation of the state standard.
Key Observations
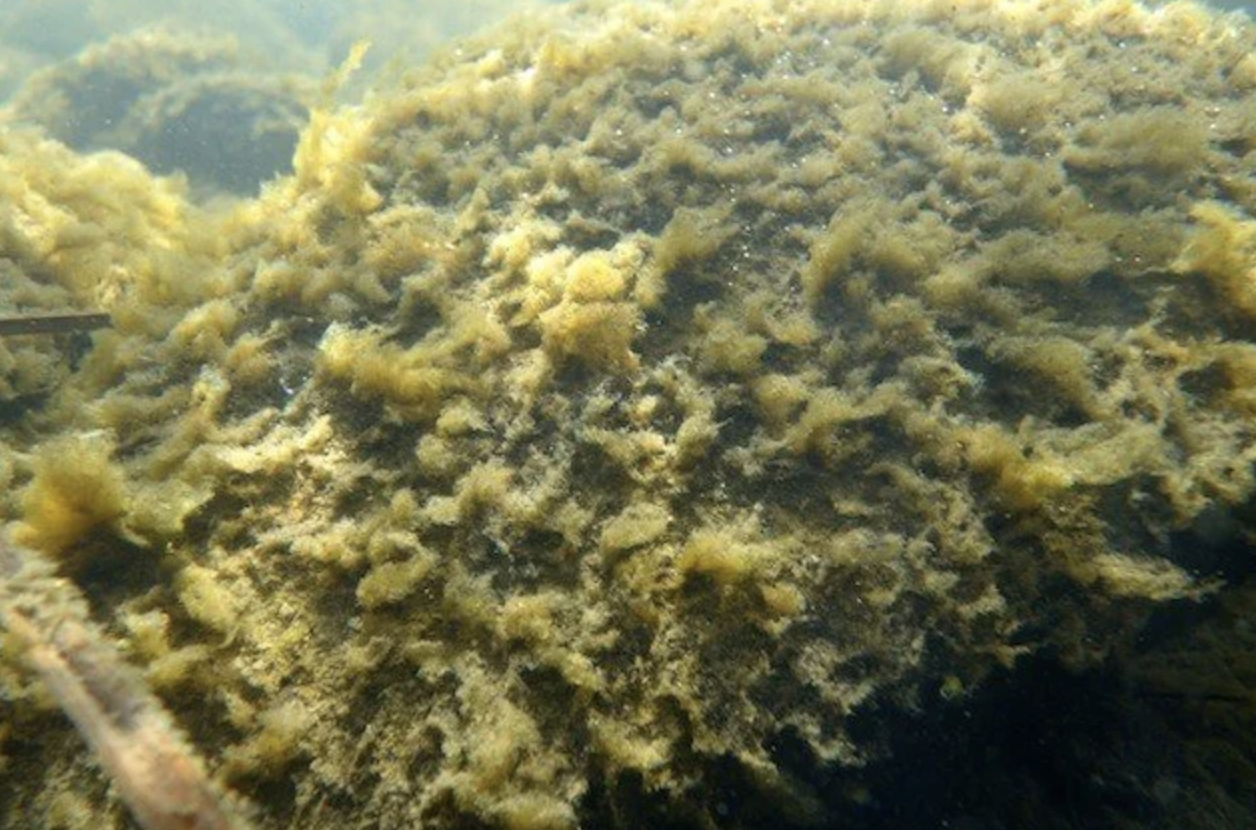
The most pressing issue across all three sites was the frequency and persistence of elevated pH, which points to nutrient enrichment within the watershed. Excess nutrients fuel excessive algal and aquatic plant growth, driving pH above acceptable levels and placing significant stress on aquatic life. Large daily swings in dissolved oxygen, as illustrated in the graph below, are a hallmark of high algal biomass resulting from this nutrient overload.
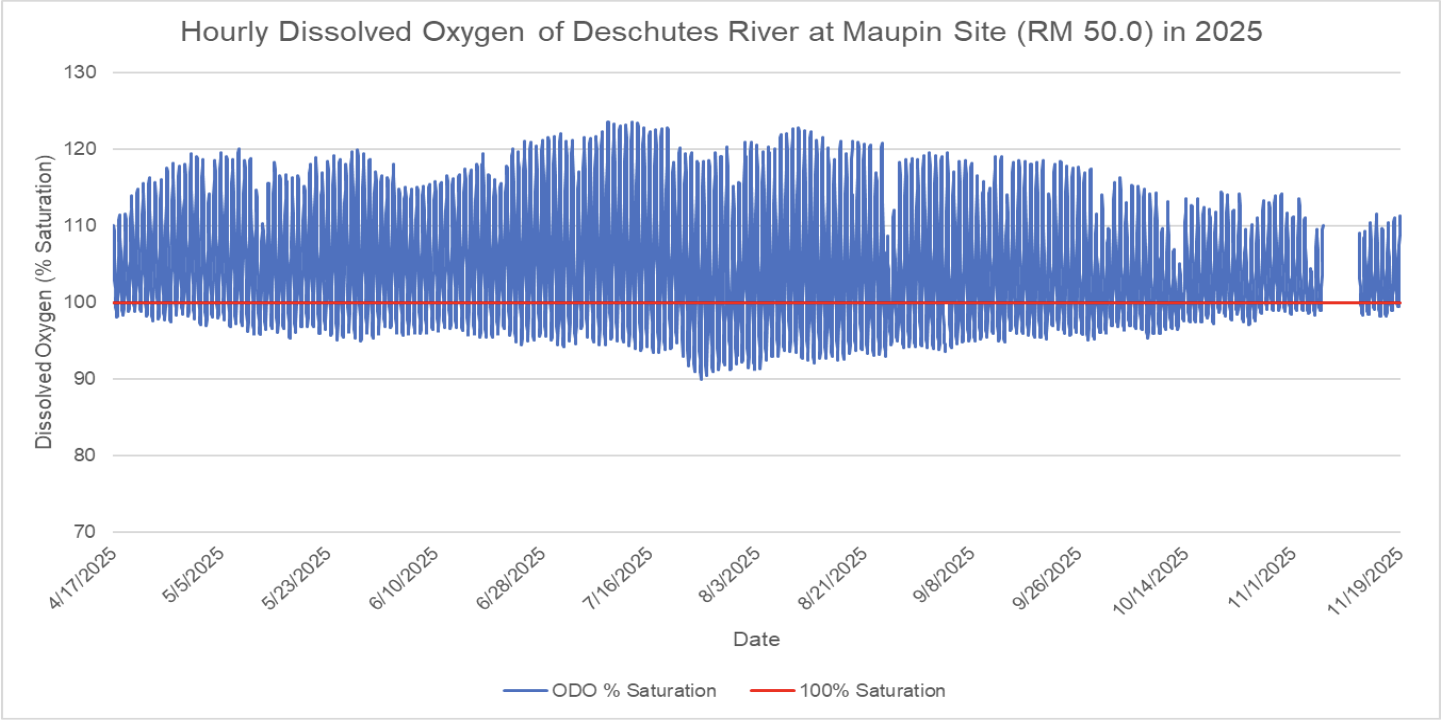
Dissolved Oxygen levels as measured at the Maupin site in 2025.
This overview highlights only a small portion of the findings that will be included in our annual water quality report. Our team is now focused on comprehensive data analysis, which will be compiled into the 2025 Water Quality Report, expected to be released in February or March of this year.
As always, we are deeply grateful to our supporters, donors, and partners. Your commitment and generosity make it possible for us to continue this vital work and to expand our monitoring efforts in support of a healthier Deschutes River.
More From The Blog


Subscribe the the DRA Newsletter
The Deschutes River Alliance is your focused voice to protect the lower Deschutes River, its cold water flows and the fish and wildlife that are sustained by them. We send regular emails with important data and news about the lower Deschutes River. We will not sell your contact information to others.
How to Support the DRA
Everyone wants clean, healthy water in the Deschutes River. Oregonians cherish our clean and healthy waterways to provide drinking water, wildlife habitat and recreational activities. The lower Deschutes River is a federally designated Wild & Scenic River, and a national treasure. It must be protected for the environmental and economic health of Central Oregon. By working together we can return the lower Deschutes River to full health.